We had two broad aims in our project. First, to synthesise the NanoFilter such that it could roll and capture stimuli. Second, to confirm the feasibility of our mechanism of action- ideally, the NanoFilter would bind blood vessels and be removed and excreted upon rolling.
We firstly generated and imaged the NanoFilter core structure and confirmed it could be folded as designed (see NanoFilter Version 1 Synthesis). We next determine double strand links between nodes optimises the balance of NanoFilter rigidity and flexibility (see Optimising NanoFilter Rigidity). We finally folded and imaged a NanoFilter with locks, such that it curled (see NanoFilter Version 2 Synthesis).
To validate feasibility in a medical context, we observed DNA Origami in the context of liquid flow and confirmed it did not degrade (see Durability of DNA Origami in Liquid Flow). We established experiments to prove that DNA Origami may be dislodged from a surface using a strand displacement reaction, which gave inconclusive results (see Origami Release by Strand Displacement).
Background
We firstly folded a prototype of the NanoFilter. This version did not have handles or locks, so could not curl or capture products. Our aim was to prove that our designed core staples and scaffold could self-assemble into the desired structure with seven nodes and six linkers.
While doing so, we aimed to optimise its folding conditions. Self-assembly of Origami occurs more efficiently in different folding environments. The major environmental variables are temperature, time of folding and salt concentration (1). At high temperatures, DNA is more prone to denature. This may be useful as it can break apart undesired bonds between base pairs, but if temperature is too high, the base pairing that is desired may not be sustainable (2). Length of time folding has similar effects on folding efficiency. DNA is typically folded in a buffer with Magnesium. The divalent cation is useful in facilitating DNA strands to come into proximity, which is typically energetically unfavourable since the DNA backbone is negatively charged (3). If salt concentrations are too low, the Origami will not fold. If salt concentrations are too high, the DNA can cluster too easily and form unwanted aggregates.
We finally hoped to prove we synthesised the NanoFilter by imaging the structure using Transmission Electron Microscopy (TEM). Running samples in gels can only prove a structure with a different size to the strands used has been synthesised, not that the desired structure has been made. TEM images the structure directly, so is helpful in proving that the intended structure is the one that has assembled.
TEM is a microscopy technique that operates on the nanoscale. It involves shining a high energy electron beam onto a sample. Thicker or denser samples will deflect more electrons, the absence of which may be detected. A dark image of a sample forms where there is less electron transmission, which is magnified onto a detector. Since electrons have minute wavelengths, the technique is sufficiently sensitive to image nanoscale samples (4).
DNA staples were resuspended to 200 μM in MilliQ Water, mixed and left overnight for the DNA to dissolve.
Staples were pooled into 13 groups. These accounted for staples from each of the seven nodes (F0N 0-6), and staples from each of the six linkers (F0L 0-5). Nodes had 29 staples and linkers had 6 staples. Each pool was diluted to a final concentration of 5 μM per staple.

We folded the DNA Origami in 24 different conditions. We used six Magnesium Chloride conditions, two folding temperature ramps (18 hours, 50-40 C and 65-25 C) and two different types of links (double stranded or single stranded). We combined the pools in the amounts below and split them into two- one set for each folding temperature ramp.
We used a scaffold that was 8064 bp long and two times excess scaffold strands.

We ran all samples in a 1.5% agarose gel. This was generated by dissolving 2.25 g agarose in 150 mL of 0.5x TE buffer, warming in a microwave and cooling. Just before it set, 1.65 mL of 1M MgCl2 was added along with 3 μL of SYBR Safe. The gel was poured into a gel box with combs that generated 20 wells that fit 20 μL each.
Scaffold was diluted 1 in 10 in folding buffer. 20 μL of each sample and the scaffold were added to 4 μL of Loading Buffer which contained bromophenol blue. 20 μL of the samples were loaded and the gel was run for 3 hours at 60 V. The running buffer consisted of 11 mM Magnesium Chloride and 0.5 xTE. It was imaged by a GelDoc (see Figure 1).

All conditions facilitated NanoFilter folding. DNA folded with a 65-25°C ramp was more prone to aggregation than DNA folded with the 50-40°C ramp. The clearest and brightest bands were seen in the 16mM salt concentration. Bands were of similar brightness between the two linker types.
The sample with the clearest and brightest band was the structure folded at 50-40°C, 16 mM Magnesium Chloride and with ds linkers. It was cut out of the gel, crushed and placed into a filter column. It was centrifuged for 15 mins at 18,0000 g and 4°C.
TEM grids were placed on a droplet of the sample and incubated for 1 min. The grid was dabbed onto filter paper and sample was stained with 3 droplets of uranium acetate. The sample was imaged at a number of magnifications (see Figure 2).

Seven nodes and six linker structures were evident in the images. Many structures independently oriented themselves in a furled and unfurled state, proving the structure had sufficient flexibility to curl.
We determined that the structure folded as per our design specifications. The seven nodes and six linker structures were evident in the images. The structure was sufficiently flexible to curl. We further determined that the optimal folding conditions are having 16mM of Magnesium Chloride, folding for 18 hours and from 50-40°C. Single stranded and double stranded link structures fold with the same efficiency.
Background
We next investigated which folding conditions allowed for the optimal flexibility of the NanoFilter. This was important, as if the structure is too rigid, it will not be able to roll upon contact with LDL cholesterol. However, if it is too flexible, it may not adopt the desired structure.
We investigated whether the linker strand type affected the flexibility of the final structure (see Diagram 1). Previous studies have indicated that using double stranded links between nodes in DNA Origami strands increases the structural rigidity (5). However, it is unclear whether the inclusion of staples in the links will be useful or detrimental to our structure.

Samples with both linker types folded in 16 mM Magnesium Chloride Buffer and at a 18 hour, 50-40°C ramp were extracted from the gel from the above experiment. This was achieved by cutting out the band, crushing the gel and centrifuging at 18000 g for 15 mins at 4°C in a filter column.
TEM grids were placed on a droplet of each sample and incubated for 1 min. The grid was dabbed onto filter paper and sample was stained with 3 droplets of uranium acetate. The sample was imaged at 100,000 times magnification. The image of the single strand link NanoFilter was less focused than the double strand link NanoFilter (see Figure 3).

We concluded both structures were sufficiently flexible to curl. The NanoFilters with single strand links appeared to self-aggregate more commonly than double strand link NanoFilters. We next attempted to quantify this result.
We measured the length of the individual Origami structures with both linker types from a number of TEM images. We took the maximum straight line length present in the Origami (see Diagram 2). In this way, if the NanoFilter was clumped, we would record a smaller in size and if it was stretched out, we would record a longer size.

Two TEM images at 100,000 x magnification were considered for each type of linker strand. 20 randomly selected structures from each image were measured by taking the longest straight line length of the Origami. This was convered into nanometers using the scale of the TEM image. The results were graphed with GraphPad Prism, in which we ran an unpaired t test to confirm that there was statistical significance between the two samples (see Figure 4).

The structures with ds links were significantly longer than those with ss links (p < 0.001). This suggests the structure with single strand links was much more prone to self-aggregation than the double strand link structure. However, the data prove that the double strand link structure could bend, as its average maximum length was still considerably lower than the actual length of the NanoFilter (218 vs 375 nm).
We determined that the double strand link structure best ensures sufficient flexibility to curl and sufficient rigidity to curl in the desired fashion. It is is therefore more apt to use in our future experiments.
@ Kavya a description of what the second NanoFilter is
@Kavya a description of what non-specific, specific and plain things are
We also wanted to ensure our locks organised the NanoFilter in the desired folded structure. As seen in Diagram 3, since the locks are non-specific it is possible they misfold with only 2 or 5 lock strands bound, or that they fold in a strained fashion. This would not be energetically favourable, but we aimed to rule out the possibility.

DNA staples were resuspended to 200 μM in MilliQ Water, mixed and left for 3 hours to allow the DNA to dissolve.
Staples were added to a number of pools (see Table 3). The staples which we knew folded well (from the previous version of the NanoFilter) were added to the same pool (Fv1-core). Similarly, the staples from linker nodes were added into the same pool (Fv1-dsDNA linkers) as we knew they bound at the linker sites.
Handles for our locks of three varieties (plain, non-specific and specific) were pooled. Their locks and the keys to remove them (of three varieties- long, short or medium) were isolated at a high concentration of 50 μM.

We were primarily interested in determining whether the NanoFilter would fold unfurled without the locks, and fold furled with the locks.
For efficiency, we therefore first folded only three samples- Nanofilters with non-specific and specific handles along with their corresponding long locks and a NanoFilter sample with plain handles and no locks (see Table 4). Staples were added in excess and a 8064 bp scaffold was used.

Samples were folded in 16 mM Magnesium Chloride TE buffer. Since the Version 1 NanoFilter folded efficiently, we folded the samples for less time- for 2 hours with the temperature incrementally dropping from 50 to 40°C.
Samples were subject to TEM imaging, but unlike for the version 1 NanoFilter, they were not gel purified beforehand.
Three TEM grids were placed on a droplet of each of the three samples and incubated for 1 min. Each grid was dabbed onto filter paper and samples were stained with 3 droplets of uranium acetate. Samples were imaged at a number of magnifications.
The staining for NanoFilters with plain or non-specific handles was too strong, and so no image could be obtained. Less stain was likely needed given the sample had staples left over.
Images of the NanoFilter with handles targetted to specific nodes were taken at a number of magnifications (see Figure 5).

The image shows a number of circular structures which mimic the expected structure of the NanoFilter. There are no structures that are straight, unlike images of the NanoFilter version 1. This indicates that the structure self-assembled into a curl which was locked, as we expected.
However, the images were not clear so conclusions are difficult to draw. This is possibly because too much stain was used for an unpurified sample. It is also possible the 2 hour folding protocol was not long enough to fold efficiently, so the structure is aggregating.
We folded a locked version of our NanoFilter as per our caDNAno design. We previously folded a DNA structure which existed in an unfurled state. When we added locks for the NanoFilter Version 2, it folded into a curled state. This validates our concept of having a DNA Origami structure whcih curling up upon attaching to its target.
We will look to advance our results in a few ways. We should image purified NanoFilters that were folded over an 18 hour period so that our TEM images are clearer. We will further look to compare the non-specific and specific handle versions of the NanoFilter to check whether one is more efficient at curling.
More broadly, we aim to prove not only that the NanoFilter can exist in both curled and uncurled forms, but also that the same NanoFilter can curl and uncurl depending on whether a lock or a key is added.
Our concept requires the NanoFilter to attach to blood vessels and remain there until it contacts small, electronegative LDL cholesterol. This means the hydrogen bonds which help it maintain structural integrity must be sufficiently strong to avoid degradation when subject to liquid flow.
Our structure is 375 nm long when it is totally unfurled. It would likely experience drag from the blood flow when attached to blood vessel endothelial cells, and so not protrude its entire length into the lumen. Literature has not comprehensively characterised blood velocity at the nanoscale level distance from vessel walls. However, studies indicate that flow velocity is proportional to distance from the vessel walls (6,7). Therefore, our DNA Origami must be able to withstand some liquid flow once attached, but not substantial flow.
We used barrels created by the 2018 University of Sydney BIOMOD team as a surrogate for the NanoFilter in our flow experiments. It was a useful surrogate as we could test the strength of the base pairing in DNA Origami in a system which had been proven to bind glass slides. See https://usydbiomod.github.io/dnaliens/wiki.html#DNADesign for details of its structure and function.
We generated two types of biotinylated barrels in our experiments- with and without fluorophores. The folding protocol was similar between the two.
Three pools of scaffolds were required to fold the barrels- scaffold, inner and outer staples (see Diagram 4). The biotinylated strands were those of the scaffold staples.

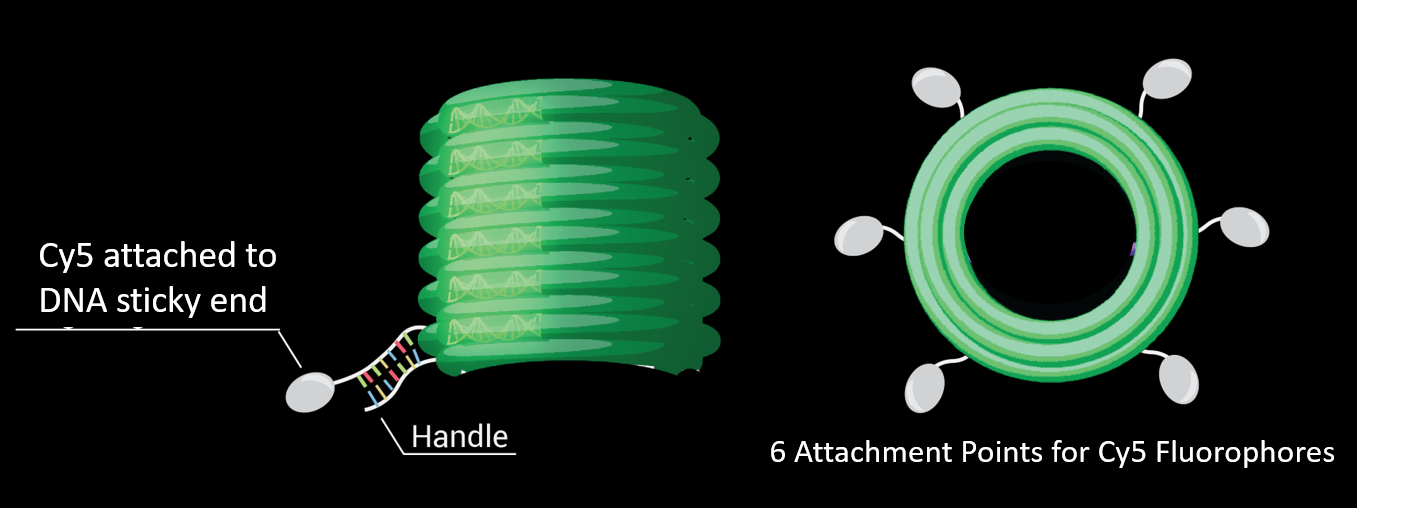
There were handles on the outer strands of the barrel to which DNA attached to Cy5 fluorophores could be added (see Diagram 5).
Pools of the three types of staples were added to a 7249 bp scaffold and folding buffer with 12 mM of Magnesium Chloride, and folded for 18 hours at 48°C (see Table 5). All pools were at a concentration of 1 μM per oligo.

The barrels were purified in a 2% agarose gel run for 2 hours at 60V, cut out, and extracted by centrifuging in a filter column at 18,000 g and 4°C for 15 mins.
For barrels that were fluorescent, the DNA concentration was measured with a nanodrop. It was typically around 3 nM. DNA strands attached to Cy5 fluorophores with ends complementary to the handles were added. We added 12 times more fluorescent strands than barrels. They were attached to the barrels over an 18 hour ramp, from 40 to 25°C. Gel purification after this step was not needed.
We used two buffers in the flow experiments-- Sodium and Magnesium Chloride wash buffers.
Sodium Chloride Wash Buffer- 1xTE, 100mM NaCl, 0.05% Tween-20
Magnesium Chloride Wash Buffer- 1xTE, 10mM MgCl2, 0.05% Tween-20
We cleaned slides and cover slips with isopropanol and let them dry. A flow chamber was constructed by adding four pieces of water-resistant double-sided tape to a glass slide and placing a cover slip on top. Excess tape was removed.
The chamber was incubated with 20 µl of BSA-Biotin (1 mg/mL) for 2 mins. The chamber was washed with 20 µl NaCl buffer by flowing in with a pipette and removing the buffer on the otherside with a lab wipe, using capillary action as the force. The chamber was next incubated with 20 µl of streptavidin (0.5 mg/mL) for 2 mins. It was then washed with 20 µl of NaCl buffer and 20 µl MgCl2 buffer (see Diagram 6). DNA Origami samples were added and the chamber was incubated for 2 mins.

We ran two flow experiments, in the flow chambers described above, and in a 96 well plate.
Flow chamber Preparation:
Flow chambers were set up as per the above description.
Excess barrels were flowed out of the tube. MgCl2 wash buffer was flowed into the tube three times, using a pipette as a suction force on the other side. This allowed the same flow fluid to move back and forth as the suction pipette expelled the fluid and the previous expelling pipette sucked up the fluid (see Diagram 7). The liquid was removed and stored.
This process was repeated but with 10, more forceful back and forth runs to simulate high flow. It was repeated in another flow chamber that did not contain streptavidin in which the liquid was removed instantly from the flow chamber. This was a positive control to prove that the amount of DNA Origami we added was detectable.

.
96 Well Plate Preparation
We incubated five cleaned wells on a 96 well plate with BSA-Biotin (1mg/mL). The wells were washed with NaCl wash buffer and all but one were incubated with Streptavidin (0.5 mg/mL) for 2 mins. The wells were washed again with NaCl wash buffer, and then with Magnesium Chloride wash buffer. Biotinylated barrels were added to each well for 2 mins. The liquid was removed and retained in the case of the no-streptavidin control well.
The other wells were subject to no, light, moderate and heavy flow by pipetting Magnesium Chloride wash buffer up and down 12 times with different force. The fluid was retained.
Samples were run on a 2% agarose gel stained with SYBR Safe (see Figure 6).

Both positive control flows (those with no streptavidin) had no biotinylated DNA stuck to the surface, and so the sample collected showed bands. This suggests we used DNA in a concentration that was detectable by the gel. No bands were detected in the flow samples, which suggests no flow was sufficient to degrade the barrels.
The experiment could be improved in two ways. First, the bands were very weak, so a more sensitive assay is needed. Second, there could have been no DNA present in the flow samples because none stuck to the plate to begin with. We next conducted a flow experiment with fluorescent barrels and a control test to check whether the DNA stuck to improve the experimental design.
We generated flow chambers with BSA/Biotin and Streptavidin as described above.
DNA Origami Barrels connected to Cy5 flurophores were flowed in and incubated for 2 mins. The liquid was flowed out of the tube, collected and stored as 'barrels that did not bind'. Magnesium Chloride wash buffer was flowed in and out of the chamber five times, using a pipette as a suction force on the other side. The liquid was removed and stored as 'slow flow'.
This process was repeated with a different flow chamber but with 15, more forceful, back and forth flows to simulate high flow. The process was also repeated in a different flow chamber with no Streptavidin, in which the liquid was removed instantly from the flow chamber as a positive control.
The samples were run on a 2% agarose gel (see Figure 7).

The fluorescent barrels were substantially easier to visualise than barrels with DNA stains. This added to the sensitivity of our experiment.
There was a substantial amount of DNA in the sample collected from the flow chamber without streptavidin (lane 3), since no biotinylated barrels stuck to the surface.
There were bands in lanes 4 and 6, which were loaded with samples of DNA that did not bind the flow chamber surface. The bands indicate not all the DNA we loaded into the chamber bound the surface. However, the bands were lighter than the control band, which indicate that some DNA did attach to the surface.
There were no barrels detected after slow flow, which suggests it was not substantial enough to break apart barrels. However, there was a series of faint bands in the lane loaded with fast flow samples. This indicates a small amount of DNA was degraded by fast flow. This was not substantial, and so we can still conclude that DNA origami is durable to flow conditions.
We repeated the experiment, but used a single flow chamber. This standardised our control experiments, which were previously conducted in different flow chambers that were slightly different sizes.
A flow chamber was constructed as per the method above. Before streptavidin was added, we flowed barrels in and removed them as a positive control. After we added streptavidin and incubated the chamber with barrels, we washed out the barrels that did not adhere to the slide and stored as 'Barrels that did not bind'.
MgCl2 buffer was flowed into the chamber and simultaneously removed on the other end by pipette suction and repulsion. This created fluid flow across the chamber, and was repeated twice. The liquid was stored as '3x flow'.
This process was repeated but with ten flows and then subsequently with 20 flows. The samples were stored as '10x flow' and '20x flow'.
Each sample was added to bromophenol blue loading buffer and loaded into a 1.5% agarose gel. This was generated by dissolving 2.25 g agarose in 150 mL of 0.5x TE buffer, warming in a microwave and cooling. Just before it set, 1.65 mL of 1M MgCl2 was added along with 3 μL of SYBR Safe.
The gel was run for 2 hours at 60 V. It was imaged by a GelDoc at the emission wavelength of SYBR Safe as well as Cy5 (see Figure 8).

Not all of our sample bound to the glass slide, as seen in the band in the presence of barrels in the sample taken after DNA incubation on the slide. However, the sample band was much lighter than the no streptavidin control lane, which indicates that some barrels bound to the slide. The barrels that did not bind were larger than those in the no streptavidin control, likely because dimers formed when two biotinylated barrels bound excess streptavidin that was not entirely washed out of the chamber.
There was no DNA detected in any of the flow samples. This suggests that the DNA origami was durable in flow conditions, as no DNA degraded after even the most significant flow.
DNA Origami does not break apart when subjected to pipette flow. In most experiments, no DNA was detected after subjecting it to even the fastest flow, which suggests it all remained attached to the surface. Even in the experiment where DNA was detected in flow samples, it was very little in comparison to the amount that had attached to the surface.
These results are only a model for the NanoFilter being subject to flow in the bloodstream. However, there are reasons to believe if the barrels can avoid degradation in experimental flow, the NanoFilter can avoid degradation in the bloostream. The barrels are less stable than the NanoFilter because they are enclosed, so place negatively charged DNA in close proximity. They would also be much less hydrodynamic than our long, flexible structure. This means the NanoFilter is less likely to degrade than the barrels.
This is an important finding as blood flow on the edge of vessels is slower than in the middle of the lumen (6,7). Therefore if DNA Origami can withstand our model of blood flow, it is likely it can withstand blood flow in the body.
Background
After the NanoFilter captures its cargo and rolls, it would ideally be released from blood vessels and be excreted. Our team explored two potential methods of how this would occur. First, since it was rolled up it would have more hydrodynamic drag and so blood flow itself could pull the structure off. Second, we could add DNA strands that could replace the NanoFilter through a strand displacement reaction.
If we were to adopt a displacement reaction release method, the NanoFilter would not bind the endothelial wall directly, but rather bind a linker DNA strand that would be attached to the endothelial wall. A complementary strand would be flowed into a patient with better affinity binding to the linker strand than the NanoFilter. It would bind the linker strand and displace the NanoFilter.
<@Kavya's diagram>
We conducted a series of experiments to test the feasibility of using displacement reactions in releasing DNA bound to a surface.
We used DNA barrels from the previous year's University of Sydney BIOMOD team as a surrogate of the NanoFilter in our experiments. This was because the lab had proven the capacity of adding fluorescent labels to the structure.
We used handles to add to the barrels on their side strands. We designed linker DNA with a biotinylated strand, complementary DNA against the handles, and a toehold that extended beyond the complementary strand. We similarly designed a displacer strand, which had DNA complementary to the entirety of the linker strand. The linker strand had a greater affinity to the displacement strand than it did to the barrel handle (see Diagram 8).

We aimed to determine whether flowing in a displacement strand could displace DNA Origami which was connected to a surface. This would mimic the displacement reaction that we could use to remove the NanoFilter.
We folded fluorescent barrels in a similar manner to flow experiments. However, we included a strand with our handle in helix 26 of the barrel, which was on the scaffold binding staples.
We made two flow chambers as per the protocol above. To both, we added BSA-Biotin (1 mg/mL), and washed out unbound biotin with Magnesium Chloride buffer. We added fluorescent barrels and flowed them out, collecting as 'No Streptavidin Control'. The barrels did not bind the glass slide because there was no Streptavidin in the chamber. The chambers were washed with NaCl buffer and then Streptavidin was added for 2 minutes. The chamber was washed with Magnesium Chloride buffer, and fluorescent barrels were again added for two minutes. Barrels that did not bind were collected for both chambers.
In the first chamber, we investigated whether the incubating the flow chamber with displacement strands would remove barrels. DNA with random bases (25 μM) was flowed into the chamber and incubated for 5 minutes as a negative control. Any barrels that were displaced were removed and stored. This process was repeated with a displacement strand complementary to the DNA linking the barrels to the slide.
In the second chamber, we investigated whether the flowing the displacement strand through the chamber would remove the barrels. DNA with random bases (25 μM) was flowed into the chamber and moved back and forth 10 times by pipetting up and down on either side of the chamber. This was used as a negative control, as there would be no displacement with DNA with random bases. Any barrels that were displaced were removed and stored. This process was repeated with displacement strands complementary to the DNA linking the barrels to the slide.
We loaded the samples in a 1.5% agarose gel. This was run at 60V for 2 hours in running buffer that contained 11 mM Magnesium Chloride and 0.5x TE. It was imaged at emission wavelengths of SYBR safe and Cy5.

A strong bands formed in the positive control lane in which we loaded fluorescent barrels that were not subject to flow (lane 2). There was also a strong band in the lanes loaded with samples from the no streptavidin control samples, which is unsurprising given biotinylated barrels would not bind to slides without streptavidin.
There were faint bands in the lanes with samples of barrels that did not bind. This suggests not all of our barrels bound the glass slide. However, since the bands were fainter than the positive controls, some barrels did bind.
No bands formed after displacement strands were added. This was true for the preparation in which the displacement strands were flowed into the chamber and in which the strands were incubated in the chamber. No strand displacement reactions occurred.
We did not observe strand displacement reactions in our experimental model. This could be for a number of reasons. It is possible the displacement strands did not have sufficient time to anneal and replace the existing handles. It is also possible that the displacement strands were not substantially better at binding the linker strand than the barrels, so displacement did not occur.
Interestingly, strand displacement is a phenomenon which would be more suited to the conditions of the body would be more favourable than the lab. The body is kept at 37°C, which is much warmer than the room temperature at which these experiments took place. The extra heat may assist in the denaturing of the DNA Origami handles from the linker strand, and therefore facilitate strand displacement.
Before starting on making our own structure, we first refined our DNA Origami synthesis skills by creating DNA Origami barrels created from last year's University of Sydney BIOMOD team, the DNAliens. See https://usydbiomod.github.io/dnaliens/wiki.html#DNADesign for details of its structure and function.
Three staple pools were used in the barrel- outer, middle and side. We combined staples and a 7249 nm scaffold from the Barrel.
Samples were subjected to one of two folding ramps- 18 h 50-40°C (65C for 15min, 50->40C for 96min per -1°C, hold at 4°C) or 18h 48°C (65°C for 15min, 48°C for 1065 min, hold at 4°C). Three sets of barrels were made for each condition (See Figure 10).

Since the lanes were all identical, we determined that there was no substantial difference between the two folding systems.
1) Douglas, S. et al. (2009) “Self-assembly of DNA into nanoscale three-dimensional shapes”. Nature, 459(7245): 414-418
2) Mariurt, J. and Doty, P. (1961) “Thermal Renaturation of Deoxyribonucleic Acids”. Journal of Molecular Biology, 3: 585-594
3) Duckett, D., Murchie, A. and Lilley, D. (1990) “The role of metal ions in the conformation of the four-way DNA junction”. The EMBO Journal, 9(2): 583-590
4) de Jonge, N. and Ross, F. (2011) “Electron Microscopy of Specimens in Liquid”. Nature Nanotechnology, 6: 695-704
5) Driller-Colangelo, A. et al. (2016) “Cargo Rigidity Affects the Sensitivity of Dynein Ensembles to Individual Motor Pausing”. Cytoskeleton, 73: 693–702
6) Segadal, L. and Matre, K. (1987) “Blood velocity distribution in the human ascending aorta”. Circulation, 76(1): 90-100
7) Riva, C. et al. (1985) “Blood Velocity and Volumetric Flow Rate in Human Retinal Vessels”. Investigative Ophthalmology & Visual Science, 26: 1124-1132
